Introduction: The Debate Over AI in Data Visualization
In the age of big data, making sense of vast amounts of information is crucial for businesses to make informed decisions. Data visualization AI tools promise to transform raw data into understandable and actionable insights through dynamic and interactive visual representations.
But here's the controversial question: Are these AI tools truly simplifying complex data, or are they over-engineering what could be straightforward insights? In this article, we’ll explore some of the top AI tools for data visualization, their features, and how they’re impacting industries worldwide.
Why Data Visualization Needs AI Tools
Turning data into insights involves analyzing, interpreting, and presenting information in a way that is easy to understand. AI tools are designed to tackle these challenges by:
Enhancing clarity: AI can automatically generate visualizations that highlight key patterns and trends.
Improving interactivity: Automated systems allow users to interact with data in real-time, fostering deeper understanding.
Increasing accessibility: AI tools can make complex data accessible to non-technical stakeholders.
But do these tools really deliver on their promises? Let’s dive into some of the top AI tools in data visualization.
Top AI Tools for Data Visualization
Here’s a breakdown of some of the most innovative AI tools currently transforming data visualization:
1. Tableau

Why it’s great: Tableau is renowned for its powerful data visualization capabilities, allowing users to create interactive and shareable dashboards.
Key features:
AI-driven analytics for automatic data insights and visualization recommendations
Drag-and-drop interface for easy creation of complex visualizations
Integration with various data sources like SQL, Excel, and cloud services
Pros:
User-friendly interface with robust AI integration
Ideal for businesses seeking comprehensive visualization solutions
Cons:
Requires a learning curve for advanced features
Subscription costs may be high for smaller businesses
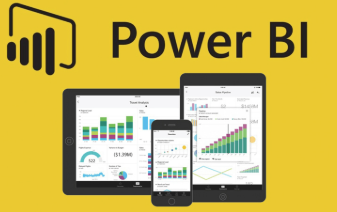
2. Power BI

Why it’s great: Microsoft Power BI offers a suite of business analytics tools to analyze data and share insights through rich visualizations.
Key features:
AI-driven insights for data modeling and visualization
Real-time dashboard updates for up-to-the-minute data analysis
Integration with Microsoft’s ecosystem for seamless data connectivity
Pros:
Strong integration with Microsoft products and services
Ideal for enterprises seeking scalable and flexible solutions
Cons:
Limited customization options compared to other platforms
Subscription costs could be prohibitive for extensive usage
3. Qlik Sense

Why it’s great: Qlik Sense provides a self-service data analytics platform with AI-enhanced capabilities for data visualization.
Key features:
AI-driven analytics for enhanced data discovery and visualization
Associative model for exploring data relationships without predefined queries
Integration with a wide range of data sources for comprehensive analysis
Pros:
Innovative associative model with AI integration
Ideal for users needing intuitive and interactive data exploration
Cons:
Requires familiarity with Qlik’s interface
Subscription costs may be high for extensive usage
4. Looker

Why it’s great: Looker, part of Google Cloud, offers a modern data platform that allows businesses to explore and visualize data.
Key features:
AI-driven data exploration and visualization for real-time insights
Customizable dashboards for tailored data presentation
Integration with Google Cloud services for seamless data handling
Pros:
Strong data exploration capabilities with AI integration
Ideal for businesses leveraging Google Cloud services
Cons:
Requires technical expertise for setup and customization
Subscription required for full feature access
5. Domo

Why it’s great: Domo provides a cloud-based platform for data visualization and business intelligence, emphasizing ease of use and collaboration.
Key features:
AI-driven insights for data visualization and decision-making
Real-time data updates for accurate and timely analysis
Integration with various business applications for a unified data view
Pros:
User-friendly interface with collaborative features
Ideal for businesses needing agile and responsive solutions
Cons:
Limited advanced features compared to larger platforms
Subscription costs could increase with additional users and features
The Pros and Cons of AI Tools in Data Visualization
While these tools offer significant advantages, they’re not without their challenges. Let’s break it down:
Pros:
Enhanced clarity: AI tools generate visualizations that highlight key patterns and trends.
Improved interactivity: Automation allows for real-time data interaction, fostering deeper understanding.
Increased accessibility: AI makes complex data accessible to non-technical stakeholders.
Cons:
High costs: Many AI tools are expensive, making them inaccessible to smaller businesses.
Complex implementation: Integrating AI tools into existing workflows can be challenging.
Dependence on technology: Over-reliance on AI may reduce human oversight and intuition.
FAQs About AI Tools in Data Visualization
Q: Can AI tools replace traditional data visualization methods?
A: While AI tools enhance efficiency and clarity, traditional methods are still essential for comprehensive data interpretation.
Q: Are these tools suitable for all types of businesses?
A: Yes, many tools like Tableau and Power BI offer scalable features suitable for various business sizes and industries.
Q: Do AI tools guarantee improved data visualization outcomes?
A: AI tools significantly enhance the chances of improved outcomes through precise analytics and automation, but success also depends on strategic implementation and user engagement.
Conclusion: Are AI Tools the Future of Data Visualization?
AI tools like Tableau, Power BI, Qlik Sense, Looker, and Domo are undeniably transforming data visualization. They offer enhanced clarity, improved interactivity, and increased accessibility, making it easier to turn data into actionable insights.
